What is Google Data Studio?
Google Data Studio is a Data Visualization and Business Intelligence Reporting Tool by Google offered for free. It’s an easy to master tool with a drag and drop interface, but very powerful tool for data visualization and business intelligence.
Uses of Google Data Studio
Google Data studio can be used to visualize your data with highly customizable charts and tables. Google Data Studio offers options to connect to a variety of data sources easily. You and your team can share and collaborate on Google Data Studio which can speed up your report creation process.
Is Google Data Studio Free?
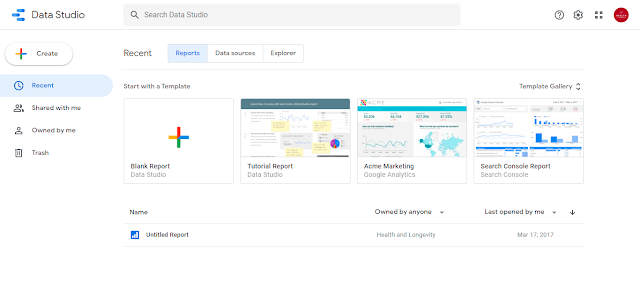
Yes, of course. You can visit Google Data Studio using this link. You’ll need a Google account to sign in to use the product. You can see an interface like this.
It is much similar to Google Docs interface. Yes indeed. This also means, Google Data Studio is using your Google Drive save your reports. You can find your Data Studio reports on your Google Drive too.
How to use Google Data Studio?
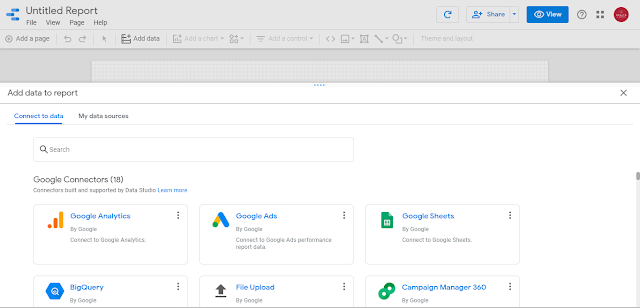
Let’s try Google Data Studio. You can see the the 'Blank Report' option with huge ‘+’ button on the welcome page. A familiar button if you have used Google docs before. Click the button to get started. You will be redirected to blank report. Now we need a data source to create a report.
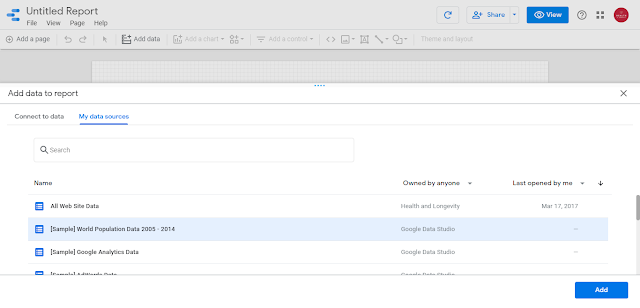
You can create a data source from numerous data sources including Google Analytics, Google Sheets, BigQuery, Google Ads, YouTube Analytics, MySQL Databases and many other popular third party data sources. But in this tutorial we are going to use a sample data source provided by Google. Select "My data sources" tab and select “[Sample] World Population Data 2005 – 2014” and click "Add" button to add the sample data source to your report.
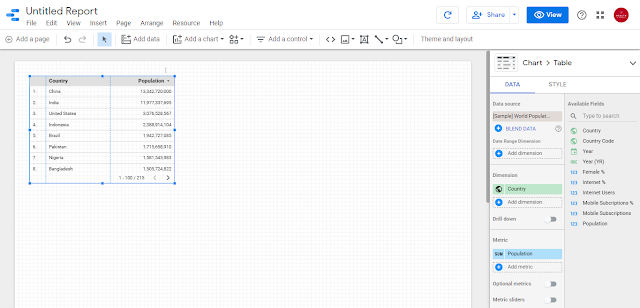
You will be asked confirmation to add data store your report. Click “Add to Report” to add the data source to your report. Now you will get an interface like this.
In here you can see a toolbar just below the menu bar. This tools bar contains all the useful tools we need to create a stunning report. In the right hand side you can find the side panel where you can customize properties of Charts you add to the report canvas.
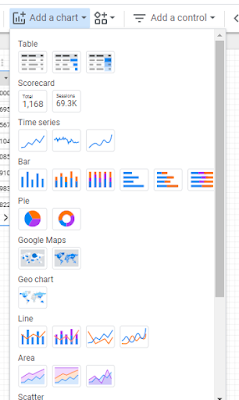
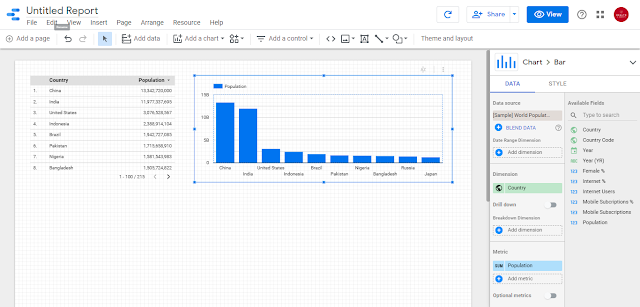
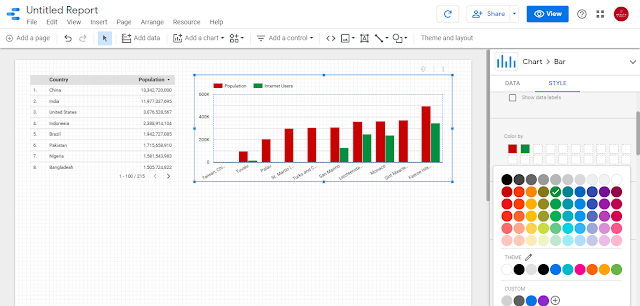
Let’s create our first chart in Google Data Studio. Click “Add a Chart” drop down menu. You can see a set of different types of charts. Select the first chart under Bar section. Now a bar chart should appear on your report canvas like in the below image (usually Google Data Studio automatically assigns Dimensions and Metrics. You can edit those dimensions and metrics from the right sidebar panel.)
Click on the place where you wanna include the chart and the chart would be added to the canvas. Drag the chart to enlarge it. This chart is showing Population from year 2005 to 2014. Chart is sorted by population.
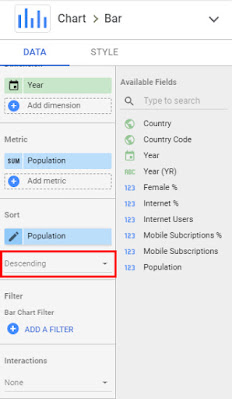
Let’s do some customizations. Go to the sidebar panel in the right side (while the chart is selected) and under Sort, change Descending to Ascending from the drop down menu.
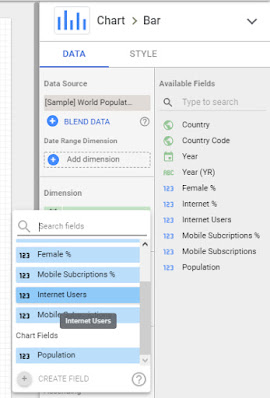
The chart will change to ascending order . Now click “Add Metric” and select “Internet Users” from the popup. This will add another set of bars with a different color.
You can change the color from the style tab. Try changing the orientation of the bar chart as well. There are lot more customization you can do to change the appearance of the charts from the Style tab. Try playing around with those customization to make your stunning report.
Before ending this tutorial, let’s see how we can name the report. Same as you can name a Google Doc file, just click on “Untitled report” and enter your desired name.
Hooray! You just create your first report in Google Data Studio. Let’s see what else we can do with Google Data Studio in another tutorial.
